


6
Million kWhs
generated for fiscal year 2025
660K
Dollars saved
for fiscal year 2025

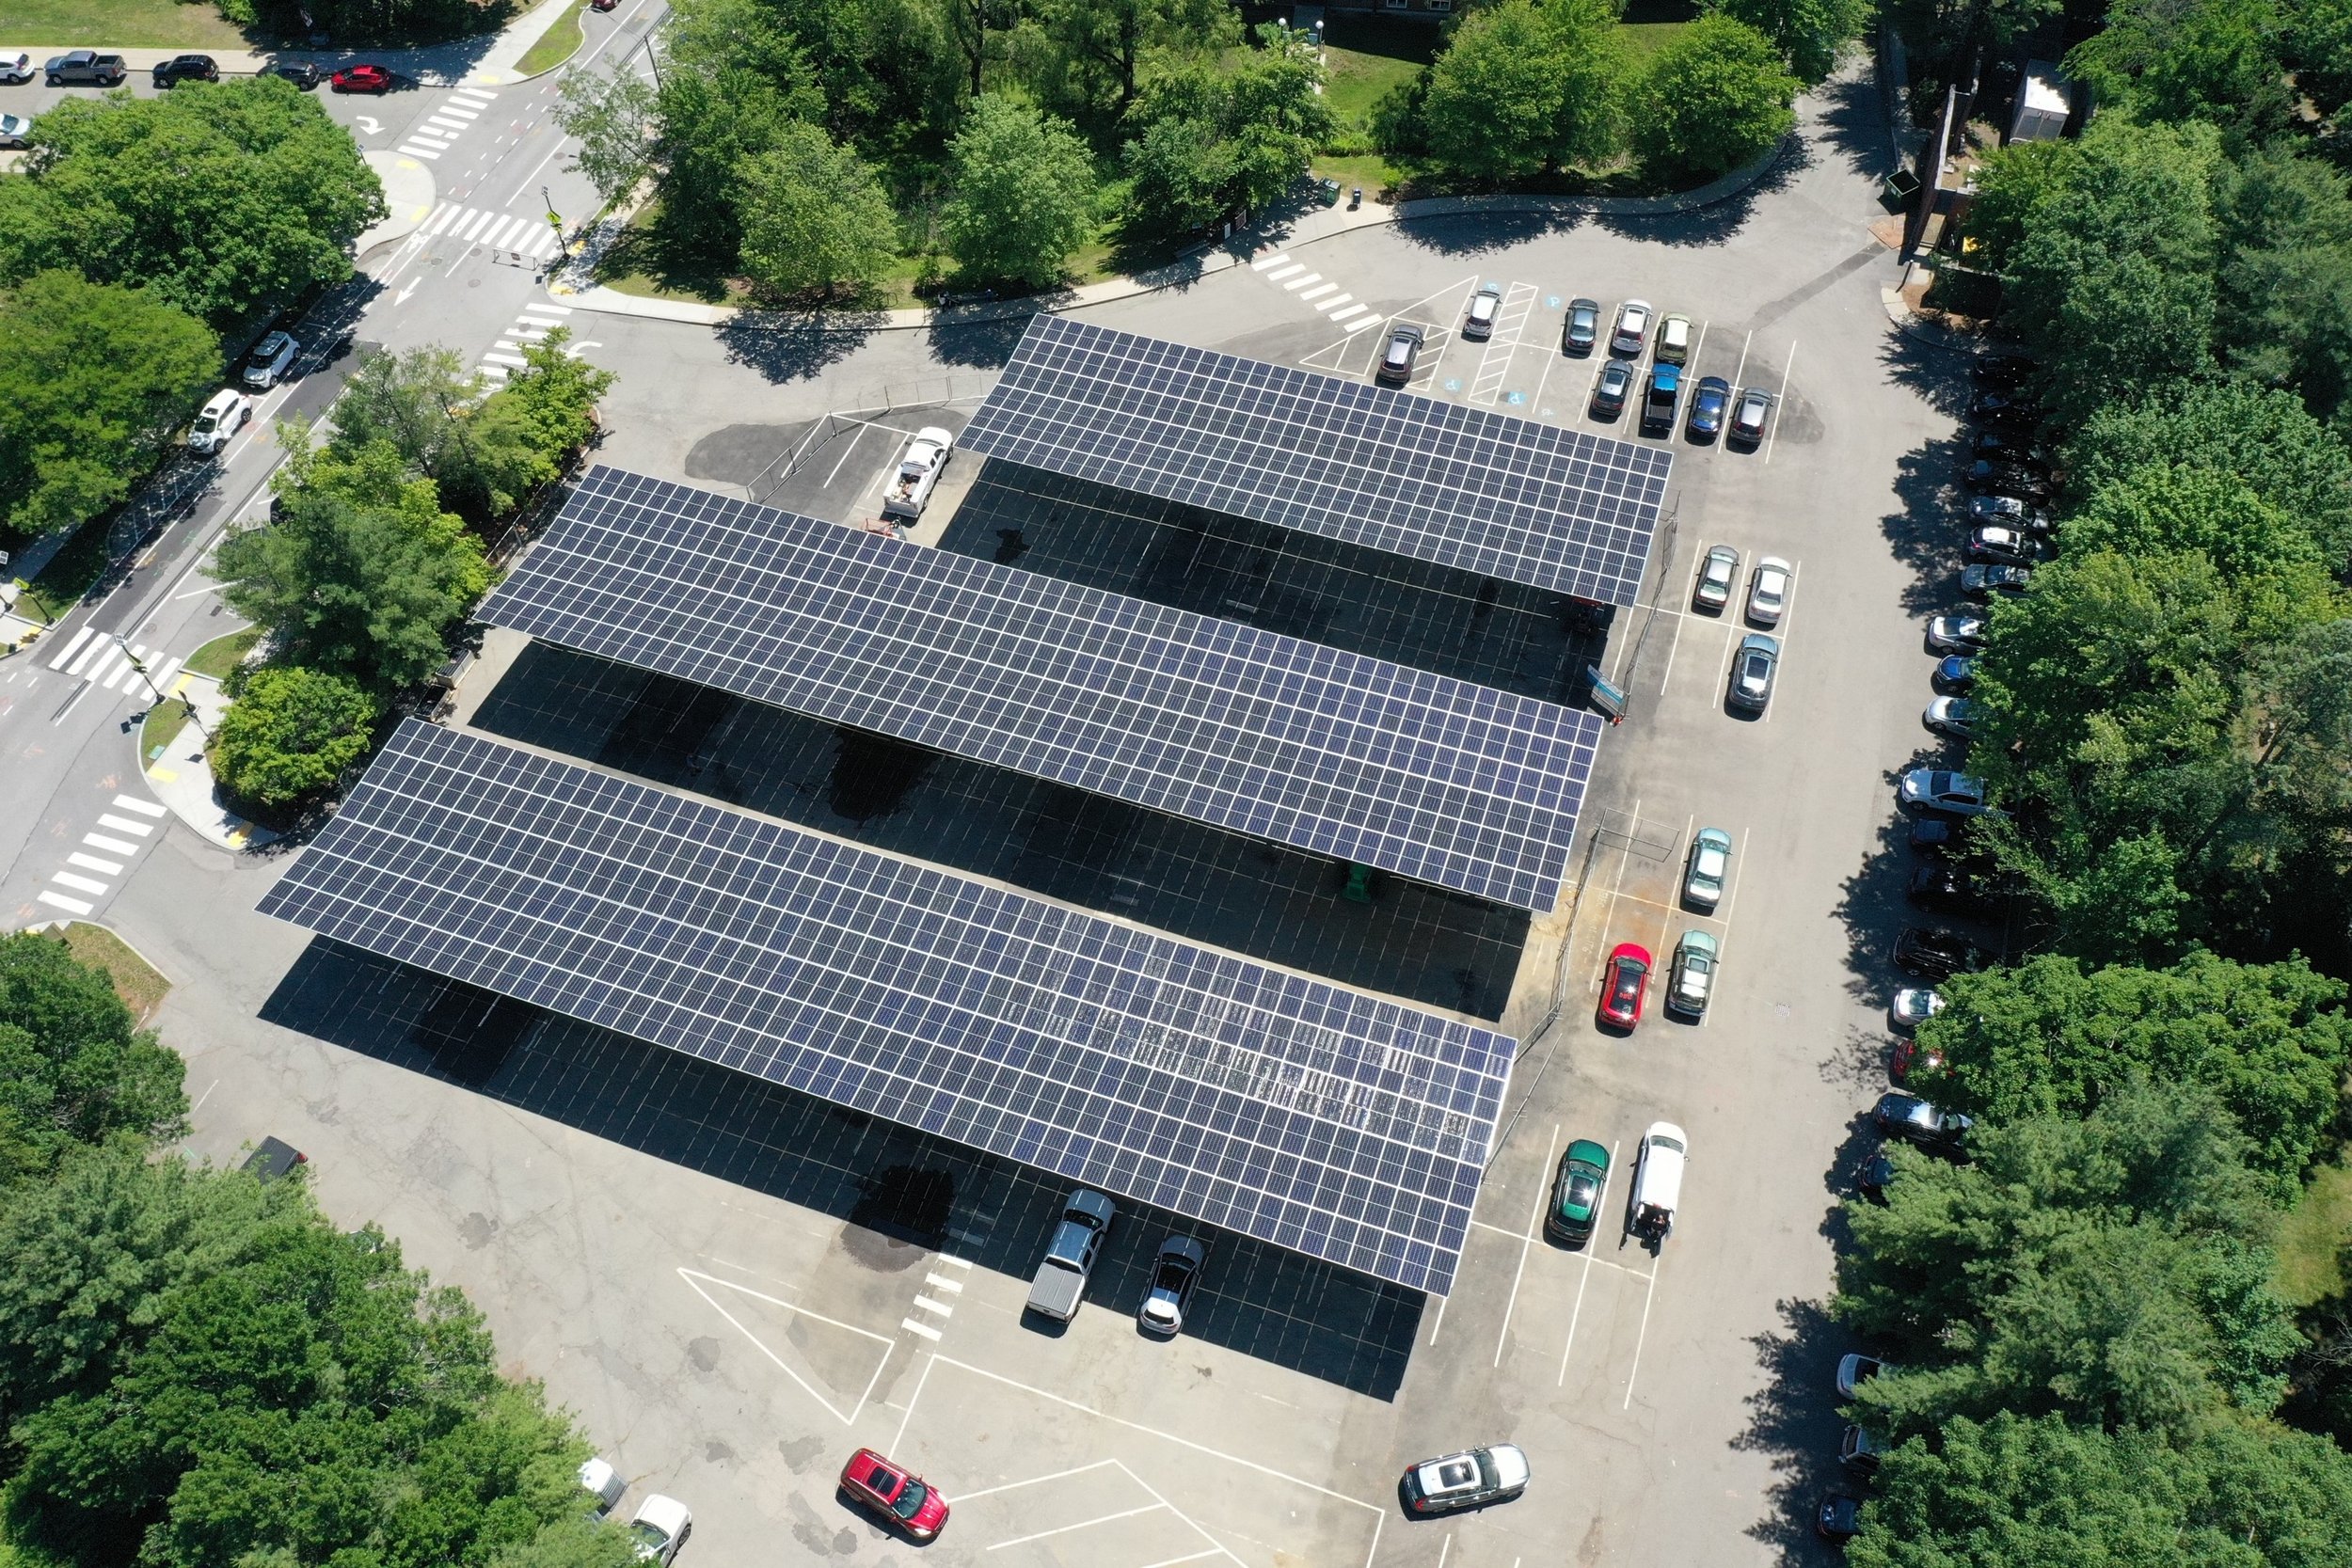
Solar Energy
Municipal Statistics
19
Projects
generating electricity in 2025
Newton’s Electricity Usage
Municipal Solar Map

Total emissions from municipal buildings
12,289
MTCO2e
Metric Tons of Carbon Dioxide Equivalent
469 kW
Average reduction in electricity demand from City buildings during peak events in calendar year 2024.
Residential & Commercial
Average size 9.26 kWh

Total of
19
Commercial Solar installations
Solar projects in Newton with a total capacity of ~20.8 MW since 2000
Total of
1,422
Average project size 15 kWh

Total of
554
Residential Solar installations
Average size 151 kWh
Energy Programs
Mass Save
1,943
Heat Pump Installations from 2019-2025 (thru Q2)
Cumulative Participation Rate in Energy Savings Programs from 2013-2023
68.5%
11.3%
Average Annual Participation Rate
$180.12
Average Annual Incentive* Received Per Household in 2023
*Incentive means money paid to participants by Mass Save Program Administrators to encourage participation in energy efficiency programs
weatherization jobs in Newton in 2025
148
through June 2025 (Data is not available prior years)
Energy Coach consults
803
As of December 2025
HERS Rating
HERS ratings (Home Energy Rating System) are a standardized measure of a home’s energy efficiency, which lower numbers indicating better performance. The City publishes HERS ratings on the Assessor’s Database. View these ratings at the link below; just scroll down under “Themes” and turn on the “HERS rating” button.

Newton Power Choice
77%
of Newton residential customers participate
(of total residential accounts in Newton)
Ongoing
exploration of new uses of Newton Power Choice to support renewables
Sources and Resources
MA Customer Profile Study (Public Mass Save data site that requires creating a free account)
Mass Save Data (Public Mass Save data site that does not require creating an account, but is more general)